
Chart is a efficient way to show information in a graphical format. It can be used to provide statistical data and other useful information for the reader. In a website, a chart can be used for various purposes, from providing statistical data to displaying important information about your business. The HT Mega Elementor Chart widget enables you to monitor the analytic side of your workflow and create sophisticated charts inside Elementor page
Steps of adding Chart Widget
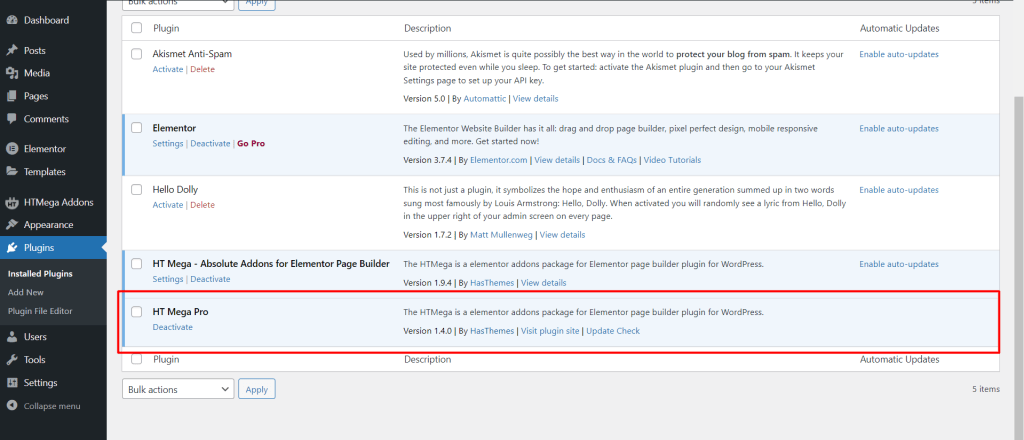
Make sure you have installed and activated the HT Mega Pro.
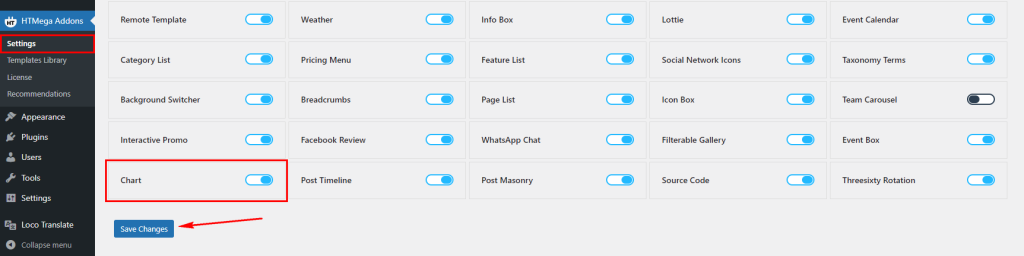
Step 1: How to Enable Chart Widget?
Go to WordPress Dashboard > HTMega Addons > Settings > Elements. From the list of Elements, enable the “Chart” widget.
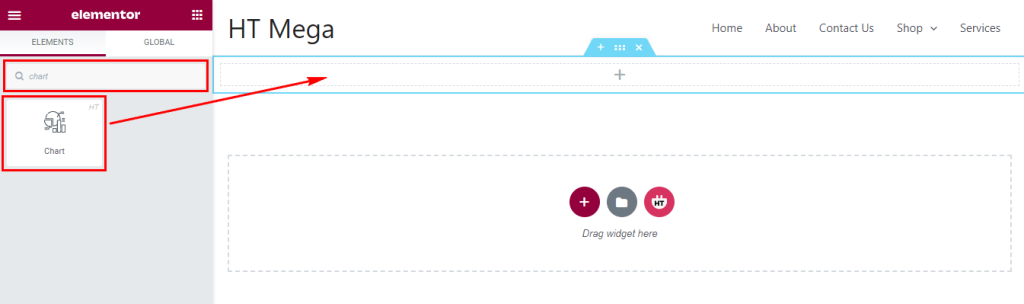
Step 2: How to use the Chart Widget?
To add the Chart Widget, search for “Chart” then drag and drop the widget having the “HT” badge.
Step 3: How to customize the Elementor Chart Widget?
Once you add the Chart widget, you will see Data Source and Settings section under the Content tab. Now, you can update them from here.
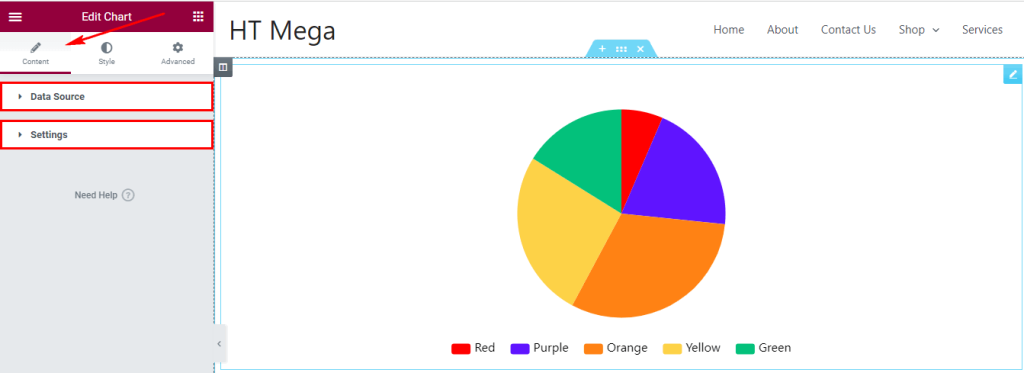
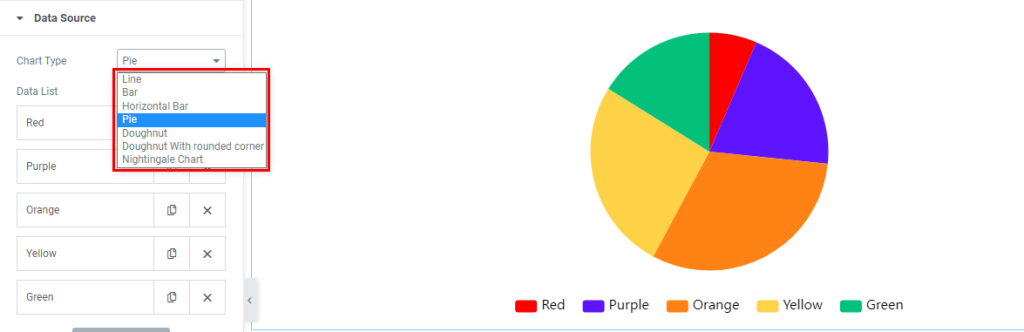
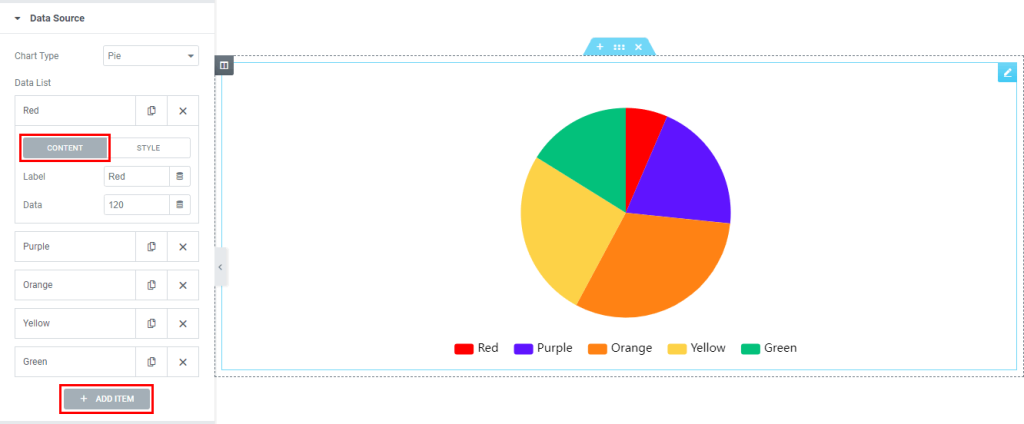
In the Data Source section you can choose the Chart Type and there you will get the Data List according to selected chart type.
You can now add as many items as you like. The Content section allows you to add item label name and data.
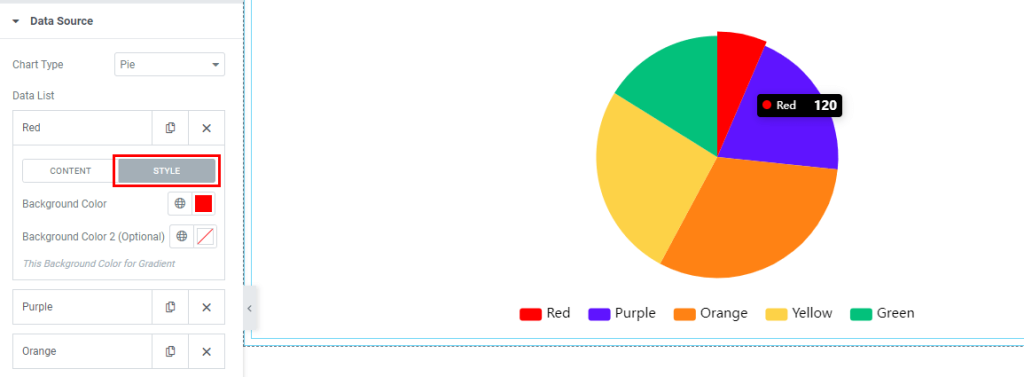
In Style section, you can add the item Background Color. If you need chart background gradient color then set the Background Color 2, otherwise there is no need to add this color.
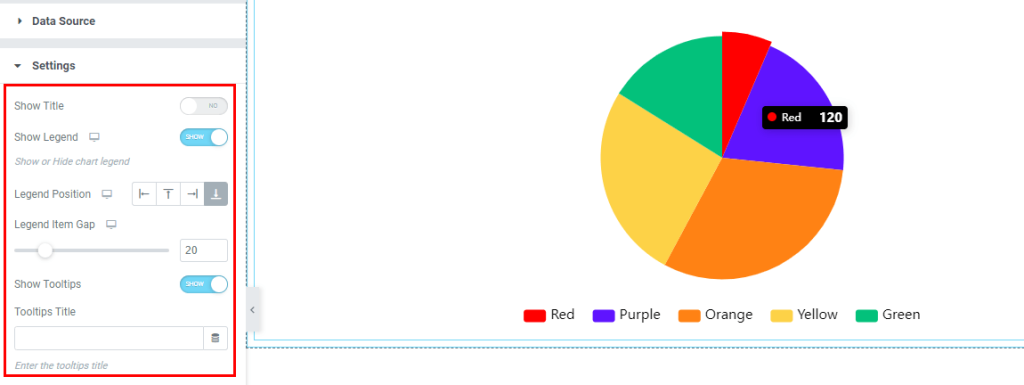
In the Settings section, you can configure Chart Title, Legend, Legend position, Legend Gap, Tooltip, and Tooltip Title as per your needs.
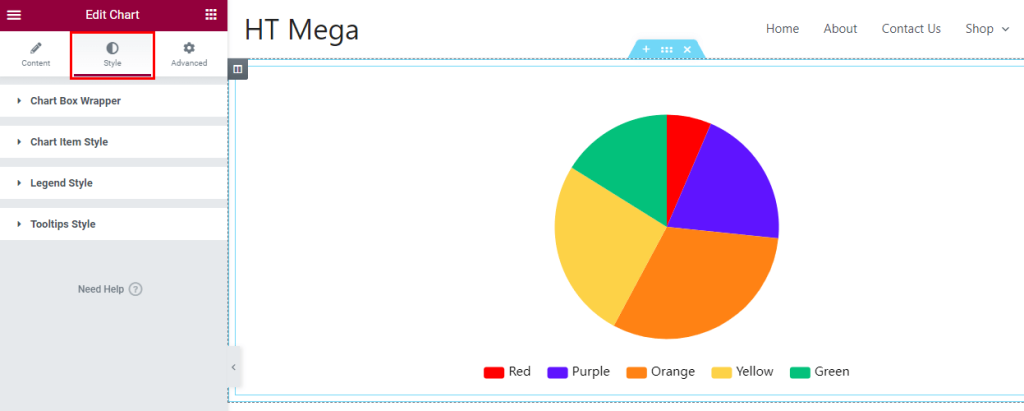
Step 4: How to customize the Elementor Chart Widget Style?
In Style tab, you can update Chart Box Wrapper, Chart Item, Legend, Tooltips style according to your needs.
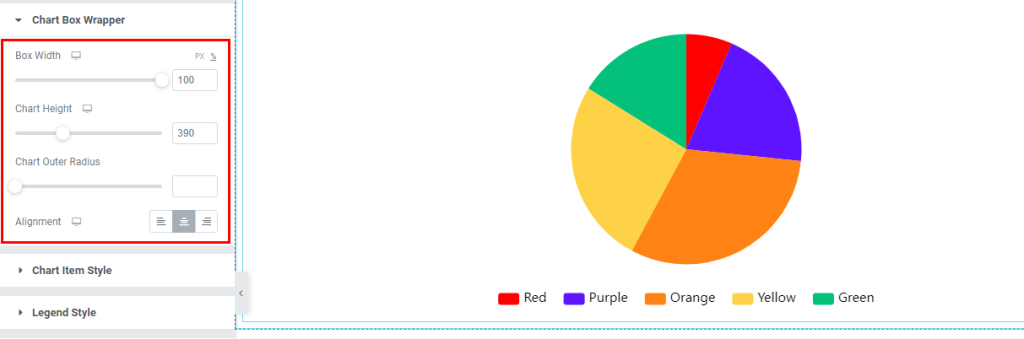
In the Chart Box Wrapper section, you can control chart box height, width, outer radius and alignment.
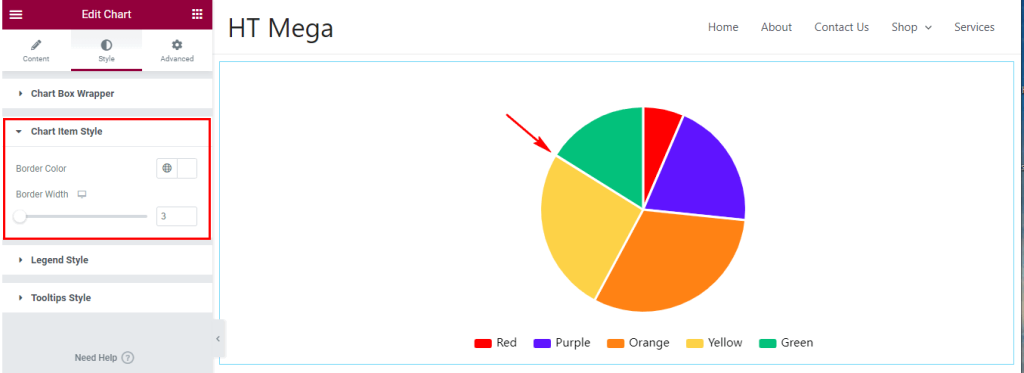
In the Chart Item Style section, you can control chart item border and border color.
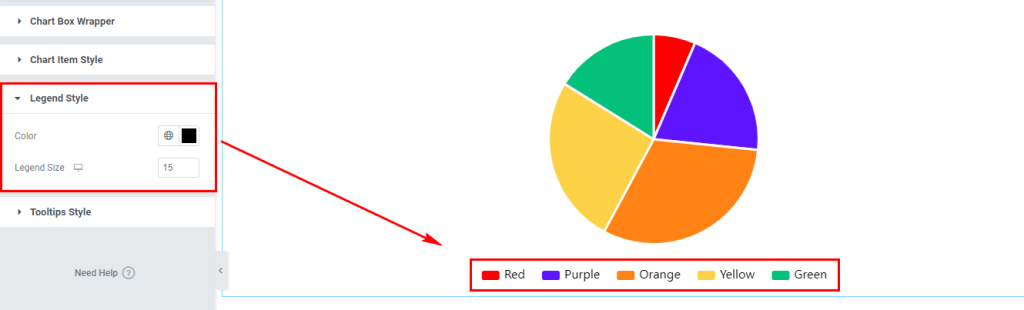
In the Legend Style section, you can update legend color and font size.
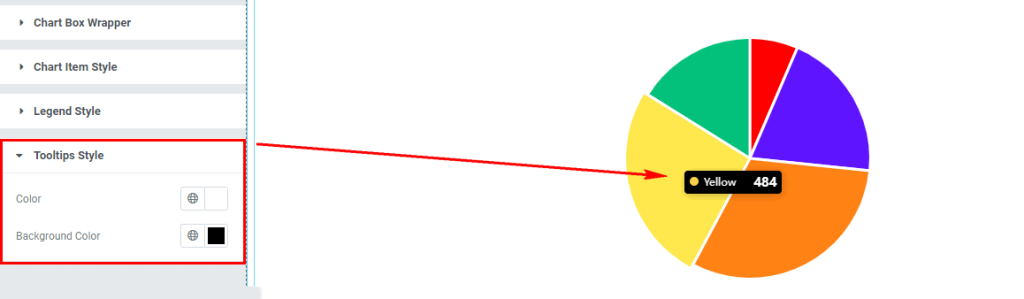
In the Tooltips Style section, you can update Tooltip text color and background color.
Usage Examples
Here are some live use cases for the Elementor Chart Addon. Follow this link to see more Demos
Import any section from the above preview with just a few clicks
From our Template library you can import all the blocks / page templates and modify the content as you prefer.
Was this helpful?
Good job! Please give your positive feedback
How could we improve this post? Please Help us.